
Don & Low Ltd – Gender Pay Gap Information
The data presented below has been prepared in accordance with the Equality Act 2010 (Gender Pay Gap Information) Regulations 2017. The figures are taken from employee data correct as of 5 April 2025.
1. Gender Pay Gap
This data includes all full pay relevant employees who have had no leave* in the pay period and shows the difference between the average hourly rate** of male and female employees.
Mean Gender Pay Gap: 11%
Median Gender Pay Gap: 7%
*‘Leave’ refers to maternity, paternity, sick leave and long-term disability.
**‘Hourly Rate’ is the ordinary/basic pay as described within the Gender Pay Gap Information Regulations.
2. Bonus Gender Pay Gap
This includes all relevant employees as of 5 April 2025 and show the difference between the bonuses paid to male and female employees.
Mean Bonus Gender Pay Gap 50%
Median Bonus Gender Pay Gap 58%
3. Proportion of male and female employees receiving bonuses
This includes all relevant employees and shows the percentage of male and female employees that were paid a bonus in the relevant pay period.
Male 8.46%
Female 5.08%
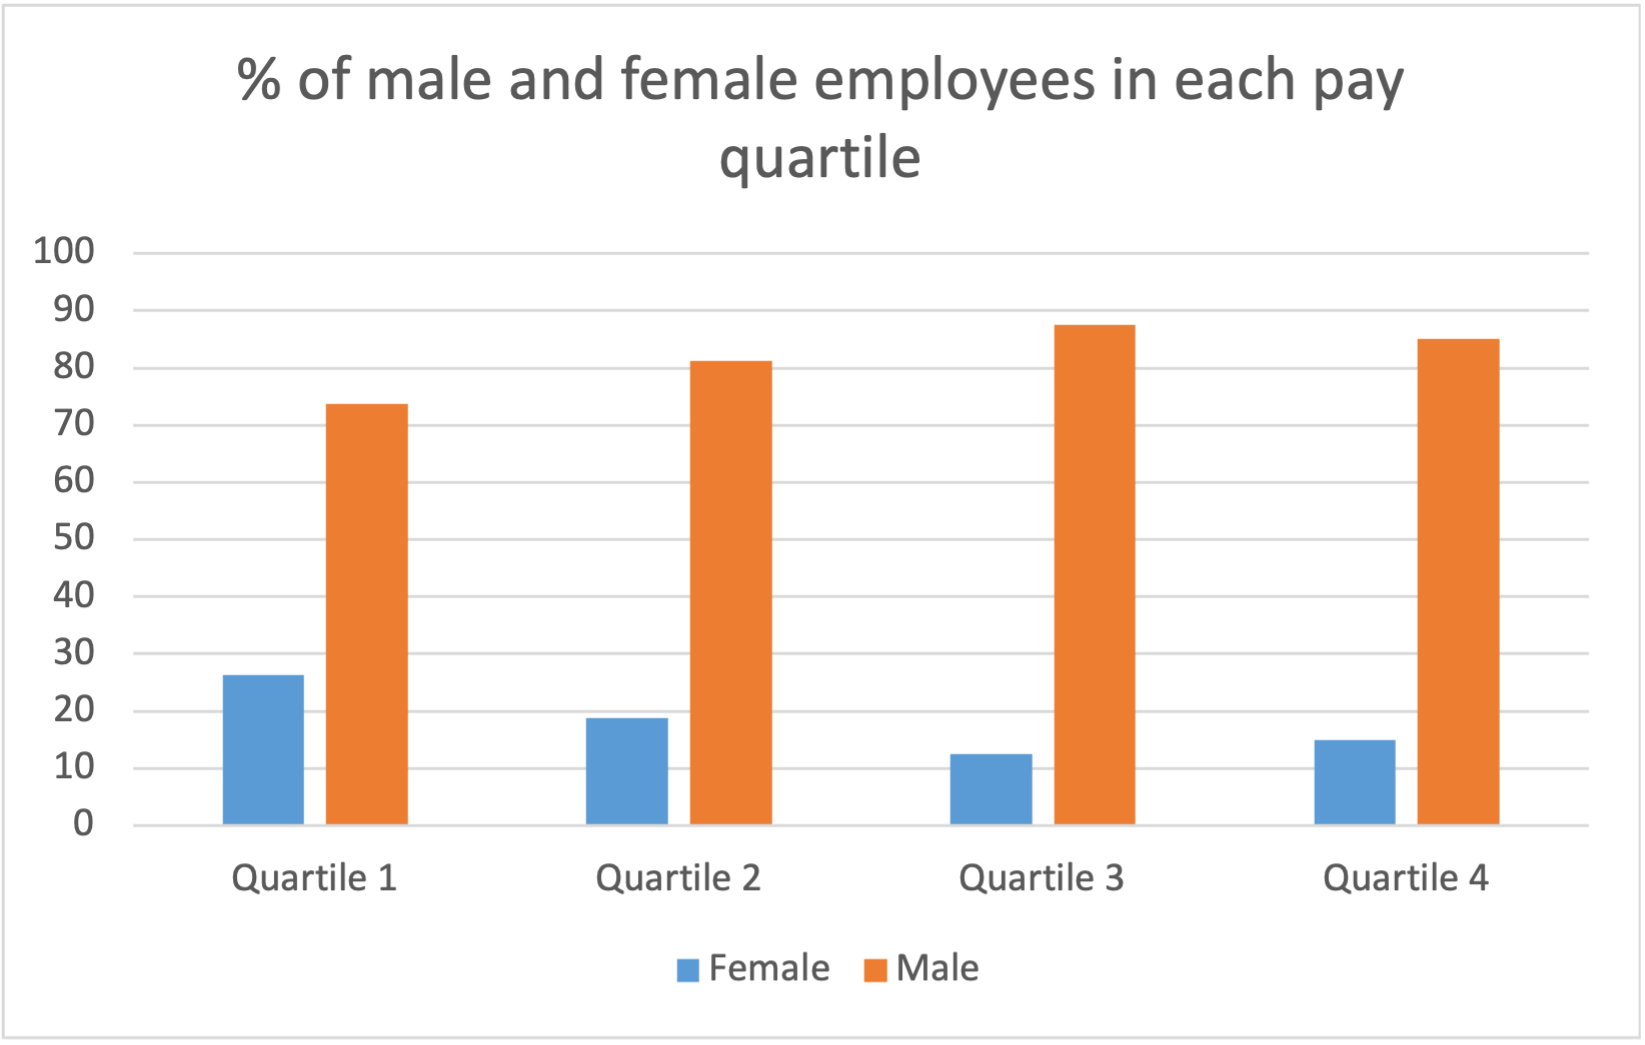
4. Male and female employees by pay quartile
This includes all full pay relevant employees who have had no leave in the relevant pay period and shows the percentage of male and female employees in each quartile.
I confirm the information and data reported is accurate as of the snapshot date 5 April 2025.

Dimitris Malamos
Chairman
Don & Low Ltd – Gender Pay Gap Information
The data presented below has been prepared in accordance with the Equality Act 2010 (Gender Pay Gap Information) Regulations 2017. The figures are taken from employee data, correct as of 5 April 2024.
1. Gender Pay Gap
This data includes all full pay relevant employees who have had no leave* in the pay period and shows the difference between the average hourly rate** of male and female employees.
Mean Gender Pay Gap: 12%
Median Gender Pay Gap: 8%
*‘Leave’ refers to maternity, paternity, sick leave and long-term disability.
**‘Hourly Rate’ is the ordinary/basic pay as described within the Gender Pay Gap Information Regulations.
2. Bonus Gender Pay Gap
This includes all relevant employees as of 5 April 2024 and show the difference between the bonuses paid to male and female employees.
Mean Bonus Gender Pay Gap 0%
Median Bonus Gender Pay Gap 0%
3. Proportion of male and female employees receiving bonuses
This includes all relevant employees and shows the percentage of male and female employees that were paid a bonus in the relevant pay period.
Male 0%
Female 1.52%
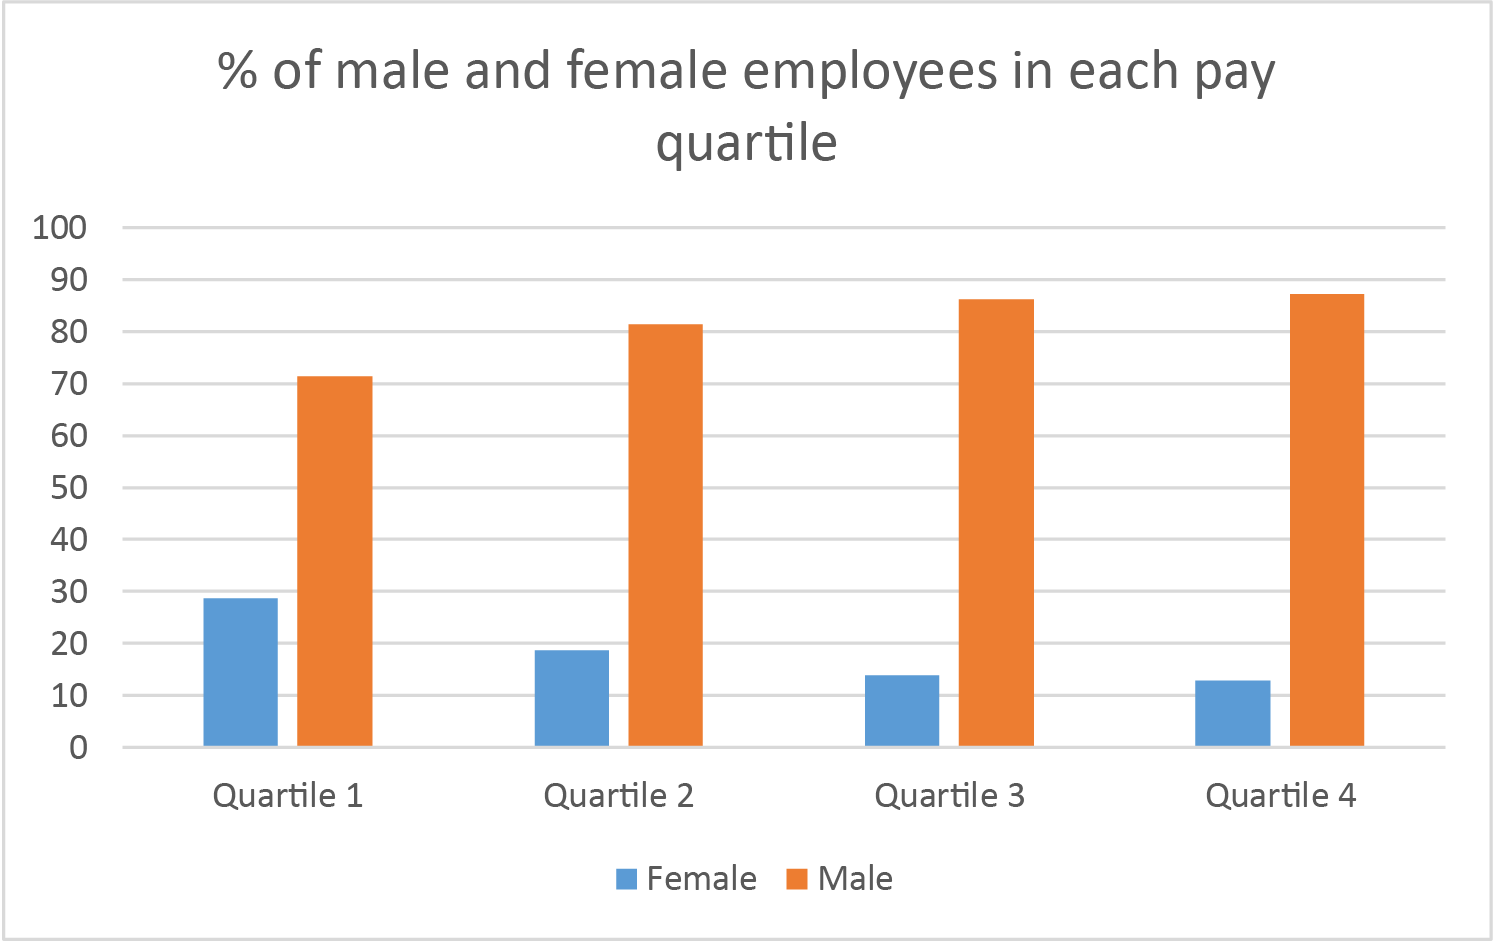
4. Male and female employees by pay quartile
This includes all full pay relevant employees who have had no leave in the relevant pay period and shows the percentage of male and female employees in each quartile.
I confirm the information and data reported is accurate as of the snapshot date 5 April 2024.
Dimitris Malamos
Chairman
Don & Low Ltd – Gender Pay Gap Information
The data presented below has been prepared in accordance with the Equality Act 2010 (Gender Pay Gap Information) Regulations 2017. The figures are taken from employee data correct as of 5 April 2023.
1. Gender Pay Gap
This data includes all full pay relevant employees who have had no leave* in the pay period, and shows the difference between the average hourly rate** of male and female employees.
This includes all relevant employees as of 5 April 2023 and show the difference between the bonuses paid to male and female employees.
- Mean Bonus Gender Pay Gap 0%
- Median Bonus Gender Pay Gap 0%
3. Proportion of male and female employees receiving bonuses
This includes all relevant employees and shows the percentage of male and female employees that were paid a bonus in the relevant pay period.
- Male 0%
- Female 0%
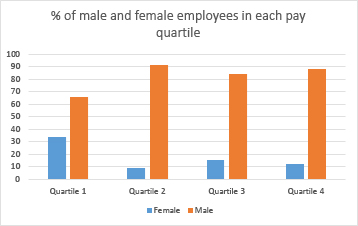
4. Male and female employees by pay quartile
This includes all full-pay relevant employees who have had no leave in the relevant pay period and shows the percentage of male and female employees in each quartile.
I confirm the information and data reported is accurate as of the snapshot date 5 April 2023.

Vassilis Zairopoulos
Chairman